Data Analyst | Sept - Dec 2024
An In-Depth Sales Analysis for Quantum Supply
The goal of this project is to uncover trends in a sea of sales data, with a primary focus on loyalty program performance, refund rates, product performance, and demographic trends.
My Role:
Create a walk-through presentation of order trends from 2019-2022 for company all-hands meeting
Provided a deep dive summary of the overall trends, growth rates, refund rates, and average order values
Ultimately this analysis supported the recommendation for the continuation of the loyalty program
Process:
Identify north star metrics to help direct the analysis and create clarity with stakeholders
Break down broader stakeholder questions into concrete questions that can be directly answered with Excel and SQL
Perform comprehensive data cleaning and validation to ensure accuracy in the sales data set
Using Excel and SQL to create tables, visualizations, and queries to uncover trends, performance metrics, and product insights
Create a summary report translating findings into clear insights and actionable recommendations
Key Recommendations
Re-engage high-value past customers through targeted retargeting campaigns to recapture approximately $200K+ in potential revenue.
Address high refund rates, especially for MacBook Air, by improving quality control, potentially saving around $130K annually.
Implement targeted promotions during peak sales months, with discount strategies on flagship products, to boost sales volume during demand surges.
Expand product categories by bundling accessories, which could generate an additional $2.7M–$4M in revenue by leveraging top-performing segments.
Focus regional growth efforts on expanding in APAC and LATAM markets through localized marketing initiatives, aiming for a 20-30% revenue increase from these regions
Quantum Supply Sales Report
About Quantum Supply
Quantum Supply is a leading e-commerce platform specializing in high-quality tech products and gadgets. Since launching in 2018, it has become a top choice for tech enthusiasts, offering a carefully selected range of premium electronics—including gaming monitors, headphones, and laptops—from brands like Apple, Samsung, and Bose. With global shipping, competitive pricing, and a constantly refreshed lineup of new products and loyalty program offers, Quantum Supply delivers an exceptional shopping experience for tech lovers everywhere.
Dataset
The dataset contains detailed records of sales transactions from 2019 to 2022 including the user id, product, purchase date, region, country, currency, and purchase platform.
The full ERD of the sales dataset can be found here.
Sales Performance Summary
Overall Trends
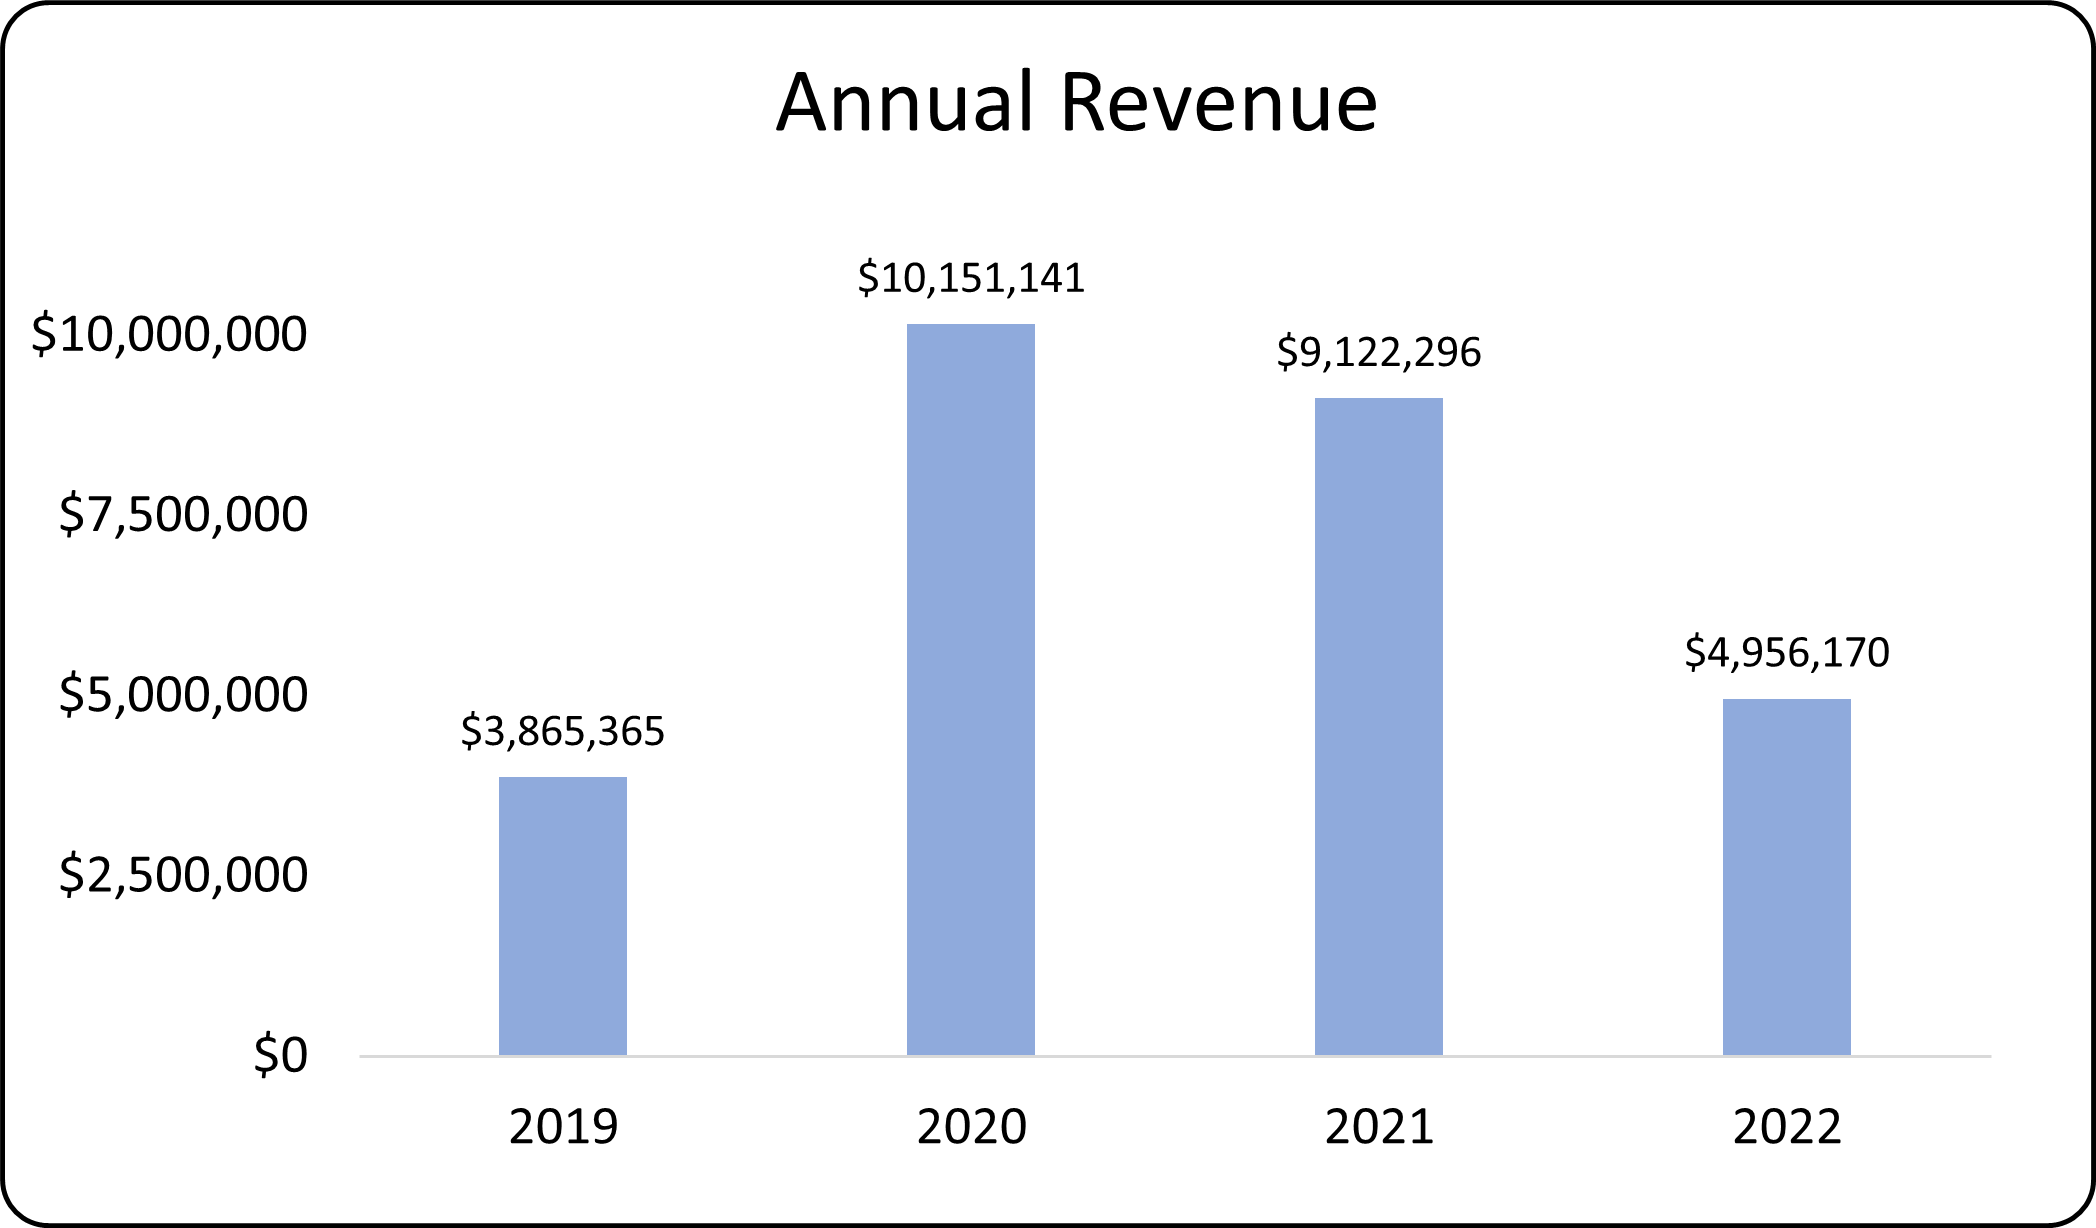
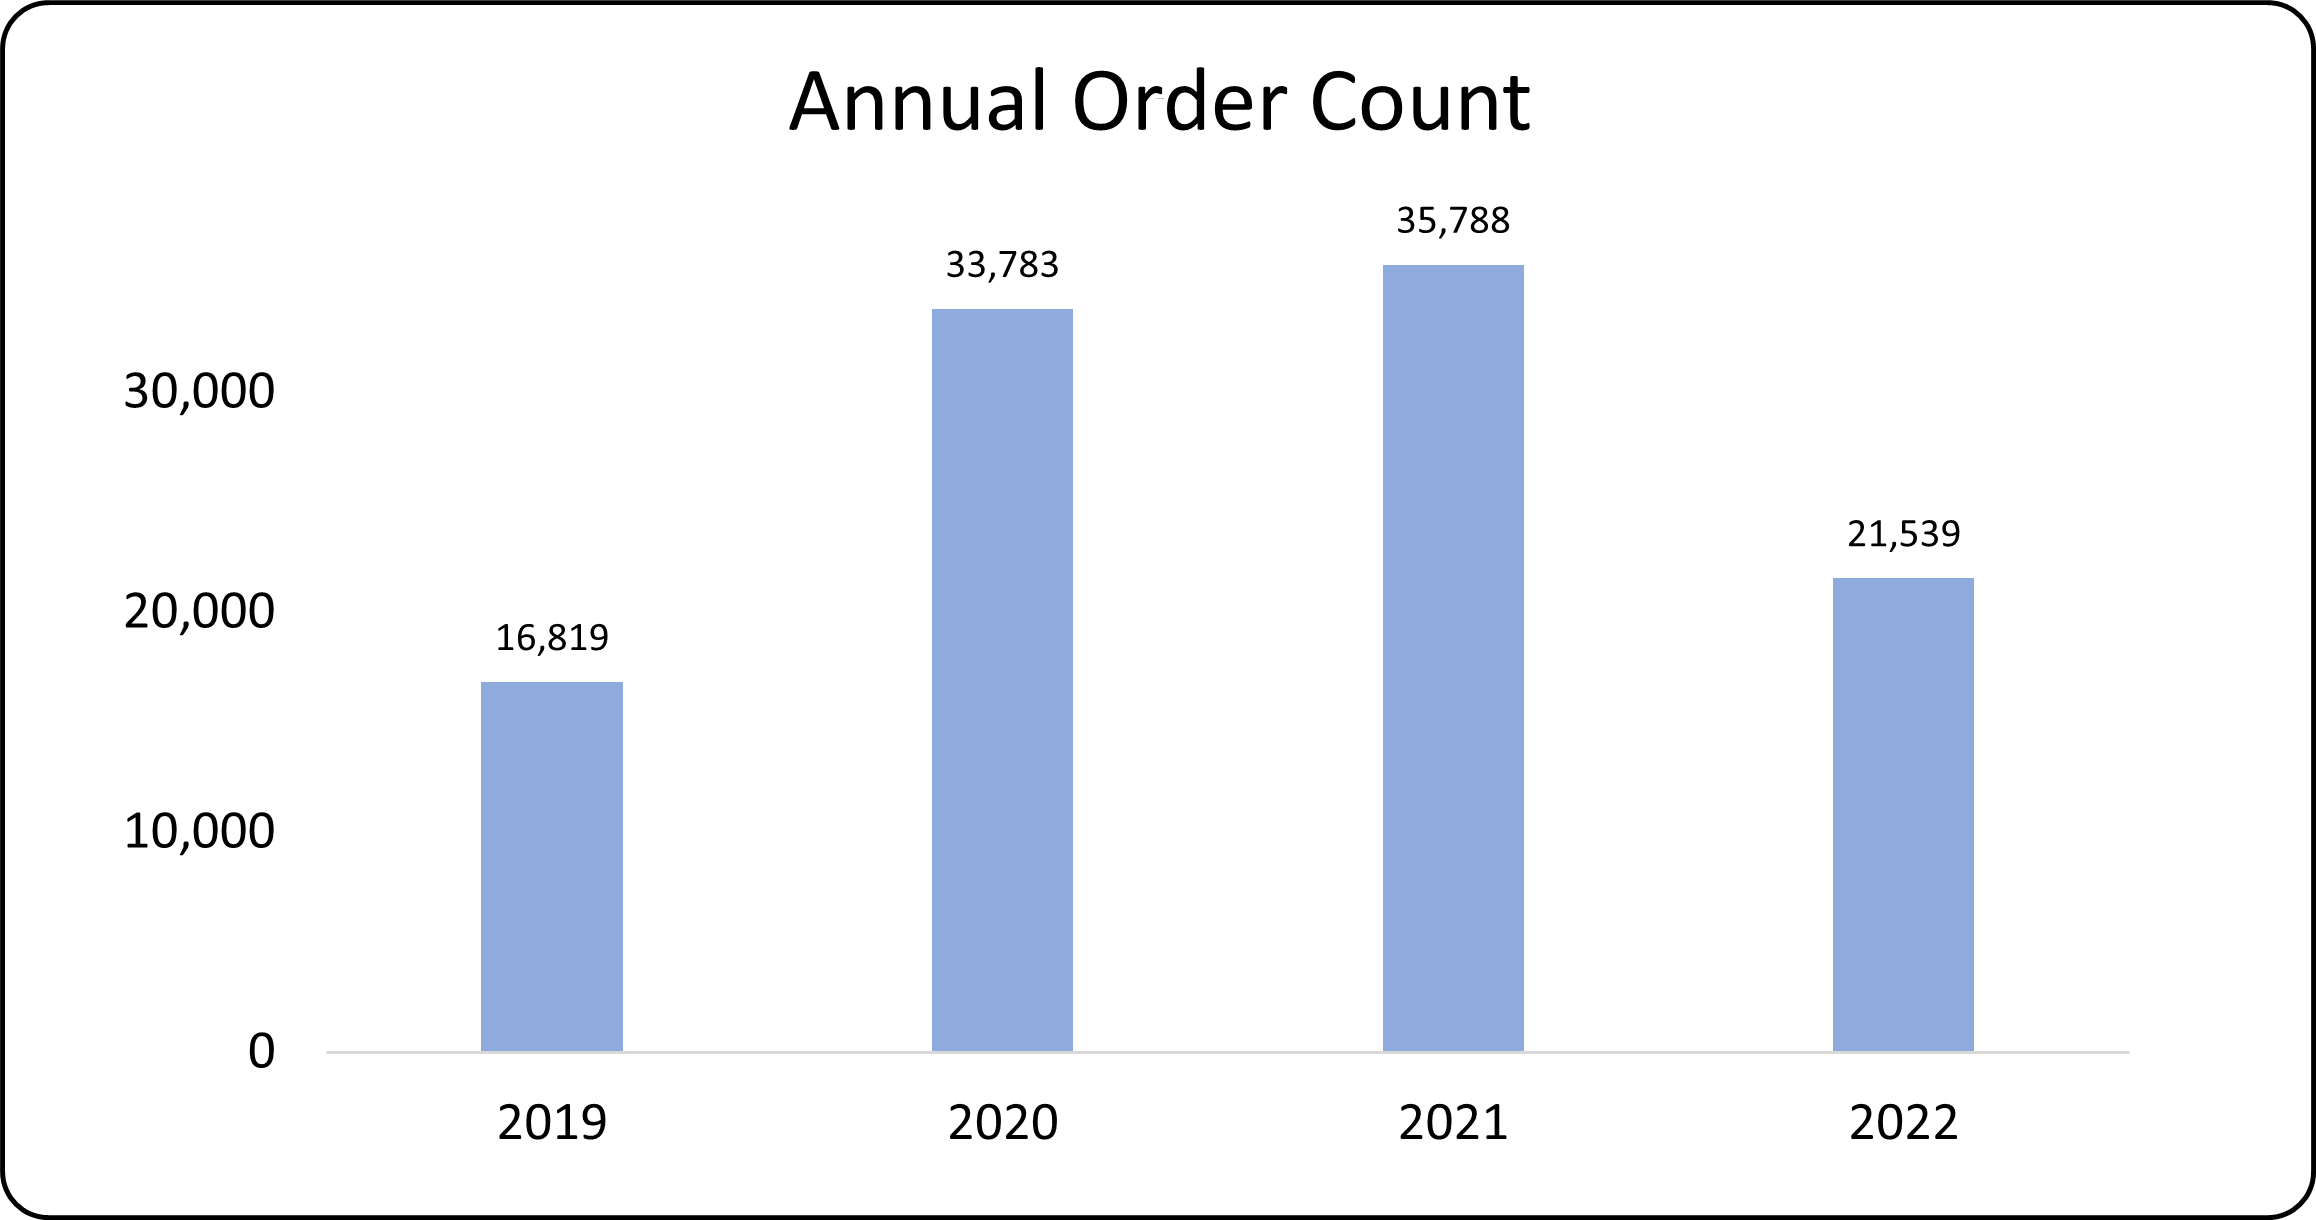
From 2019-2022, the company generated $28M from 108k total orders, 2019 saw the lowest annual revenue at $3.8M with a peak annual revenue reaching $10M in 2020.
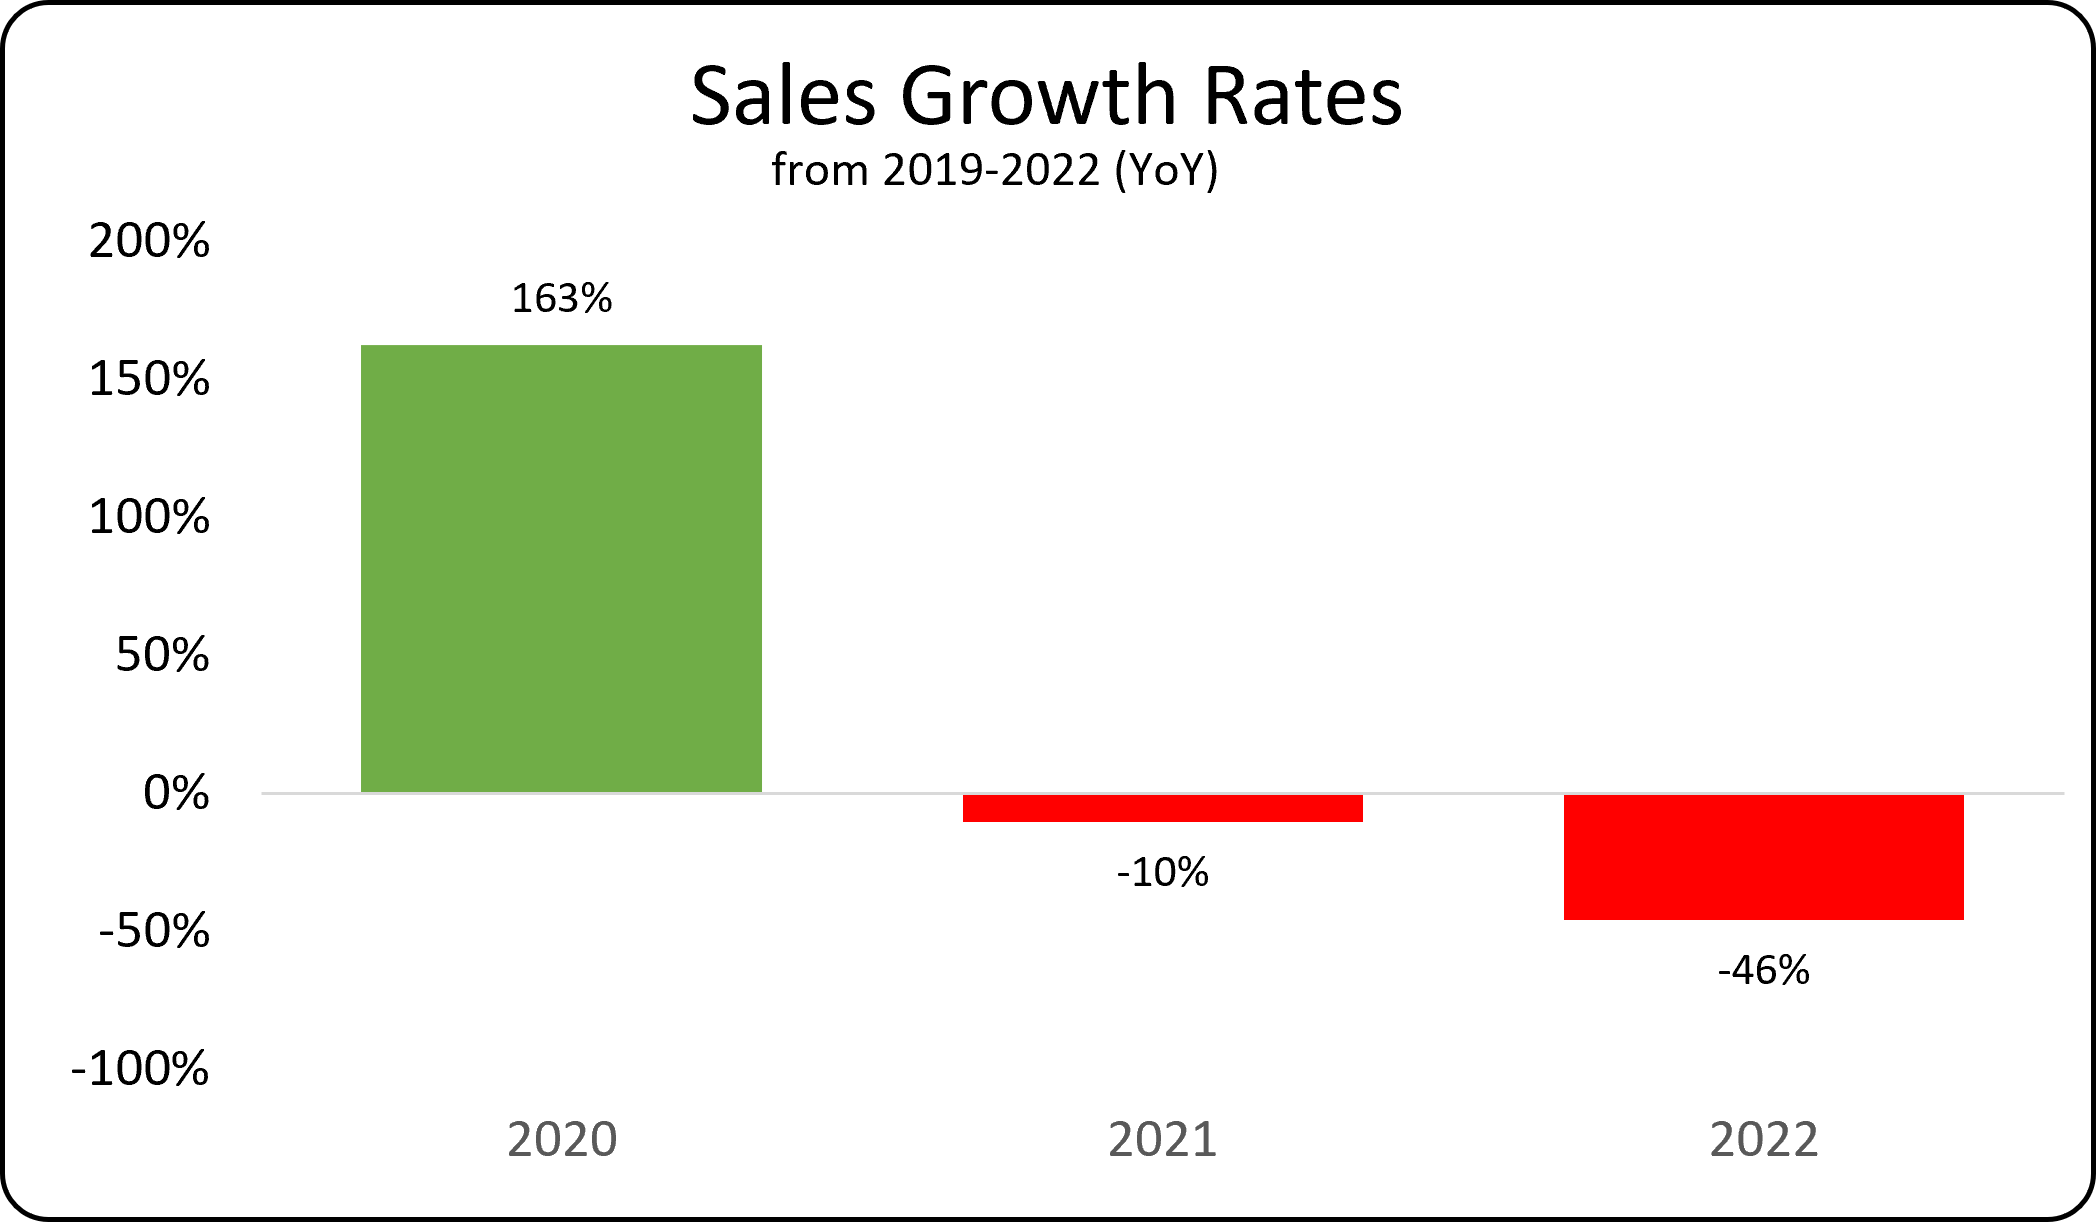
Annually the largest sales growth occurred between 2019 and 2020 at 163% (YoY) , while 2021 to 2022 experiencing a 46% decline in sales year over year.
Best-Selling Product/Region
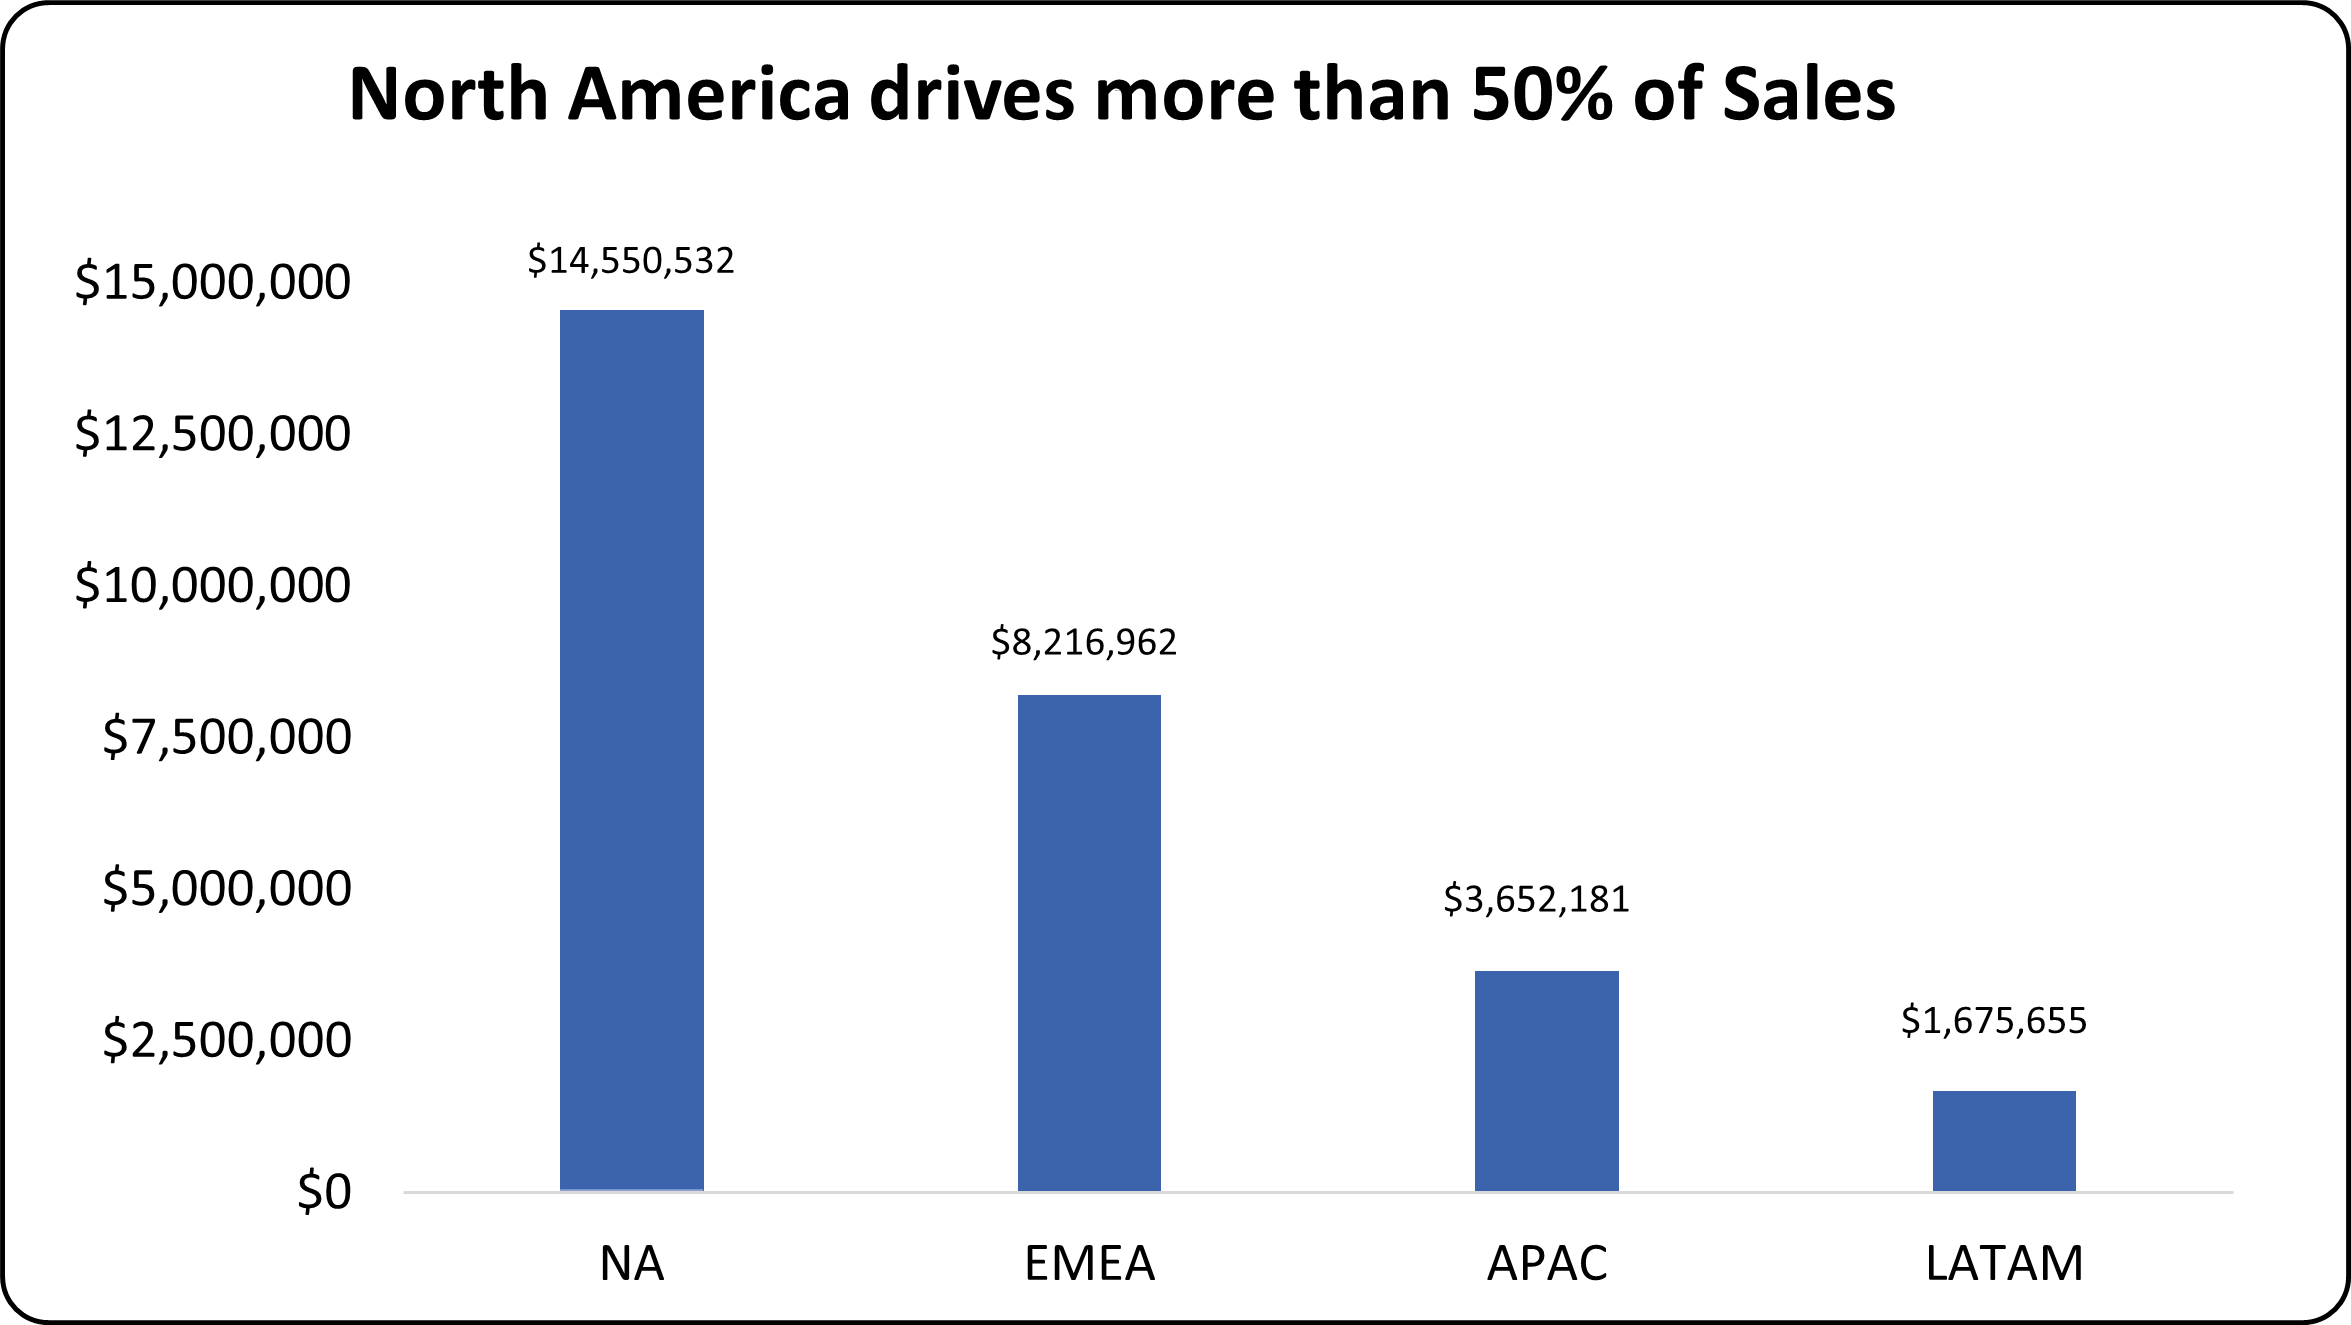
North America, particularly the U.S., accounted for over 50% of revenue, with $14M in sales from 50k orders.
The 27-inch 4K Gaming Monitor, Apple AirPods, MacBook Air, and Thinkpad Laptop contributing 96% of total sales, amounting to $27M combined.
Loyalty Program
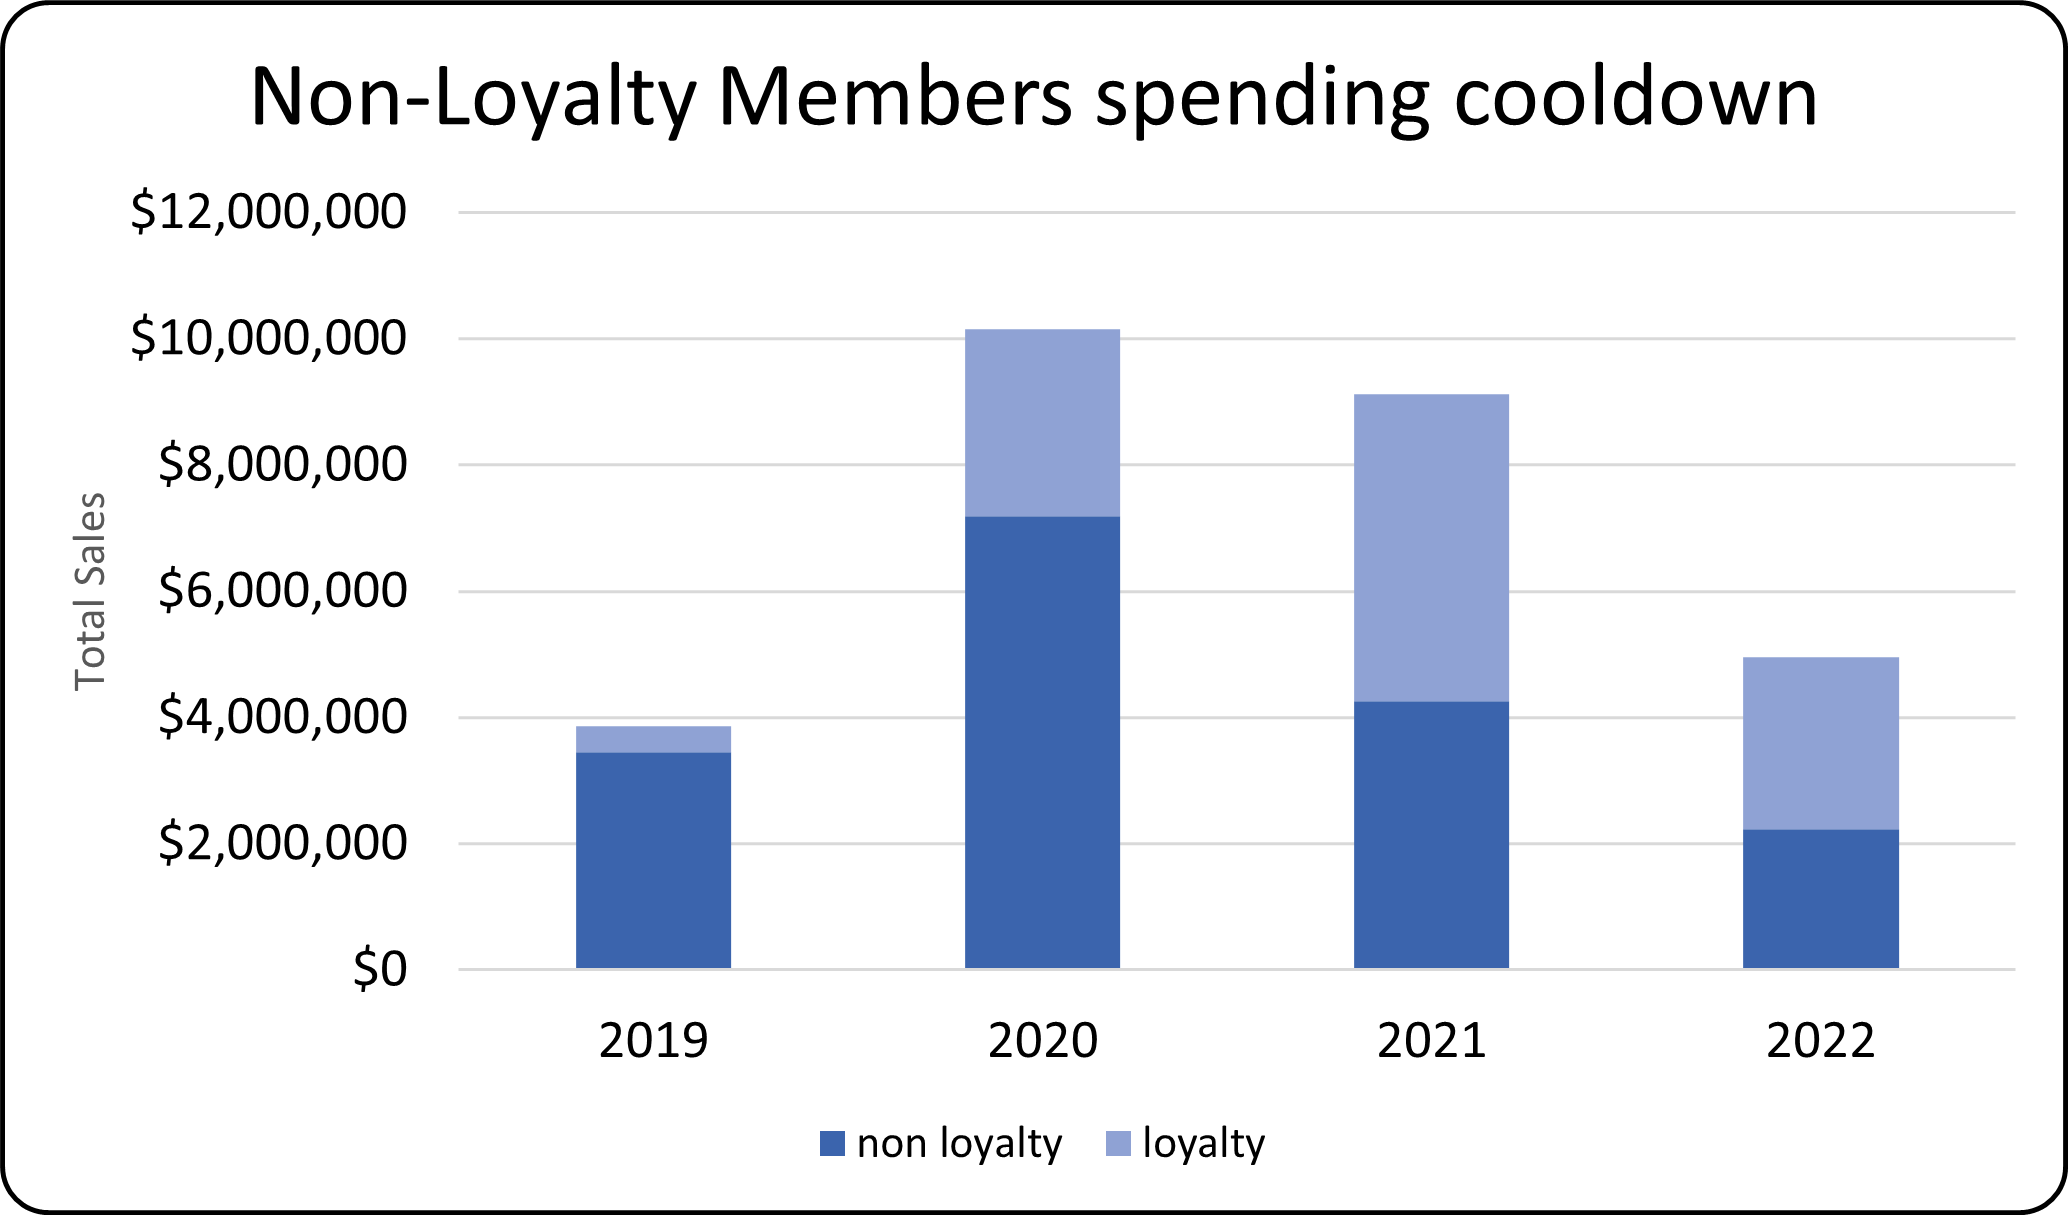
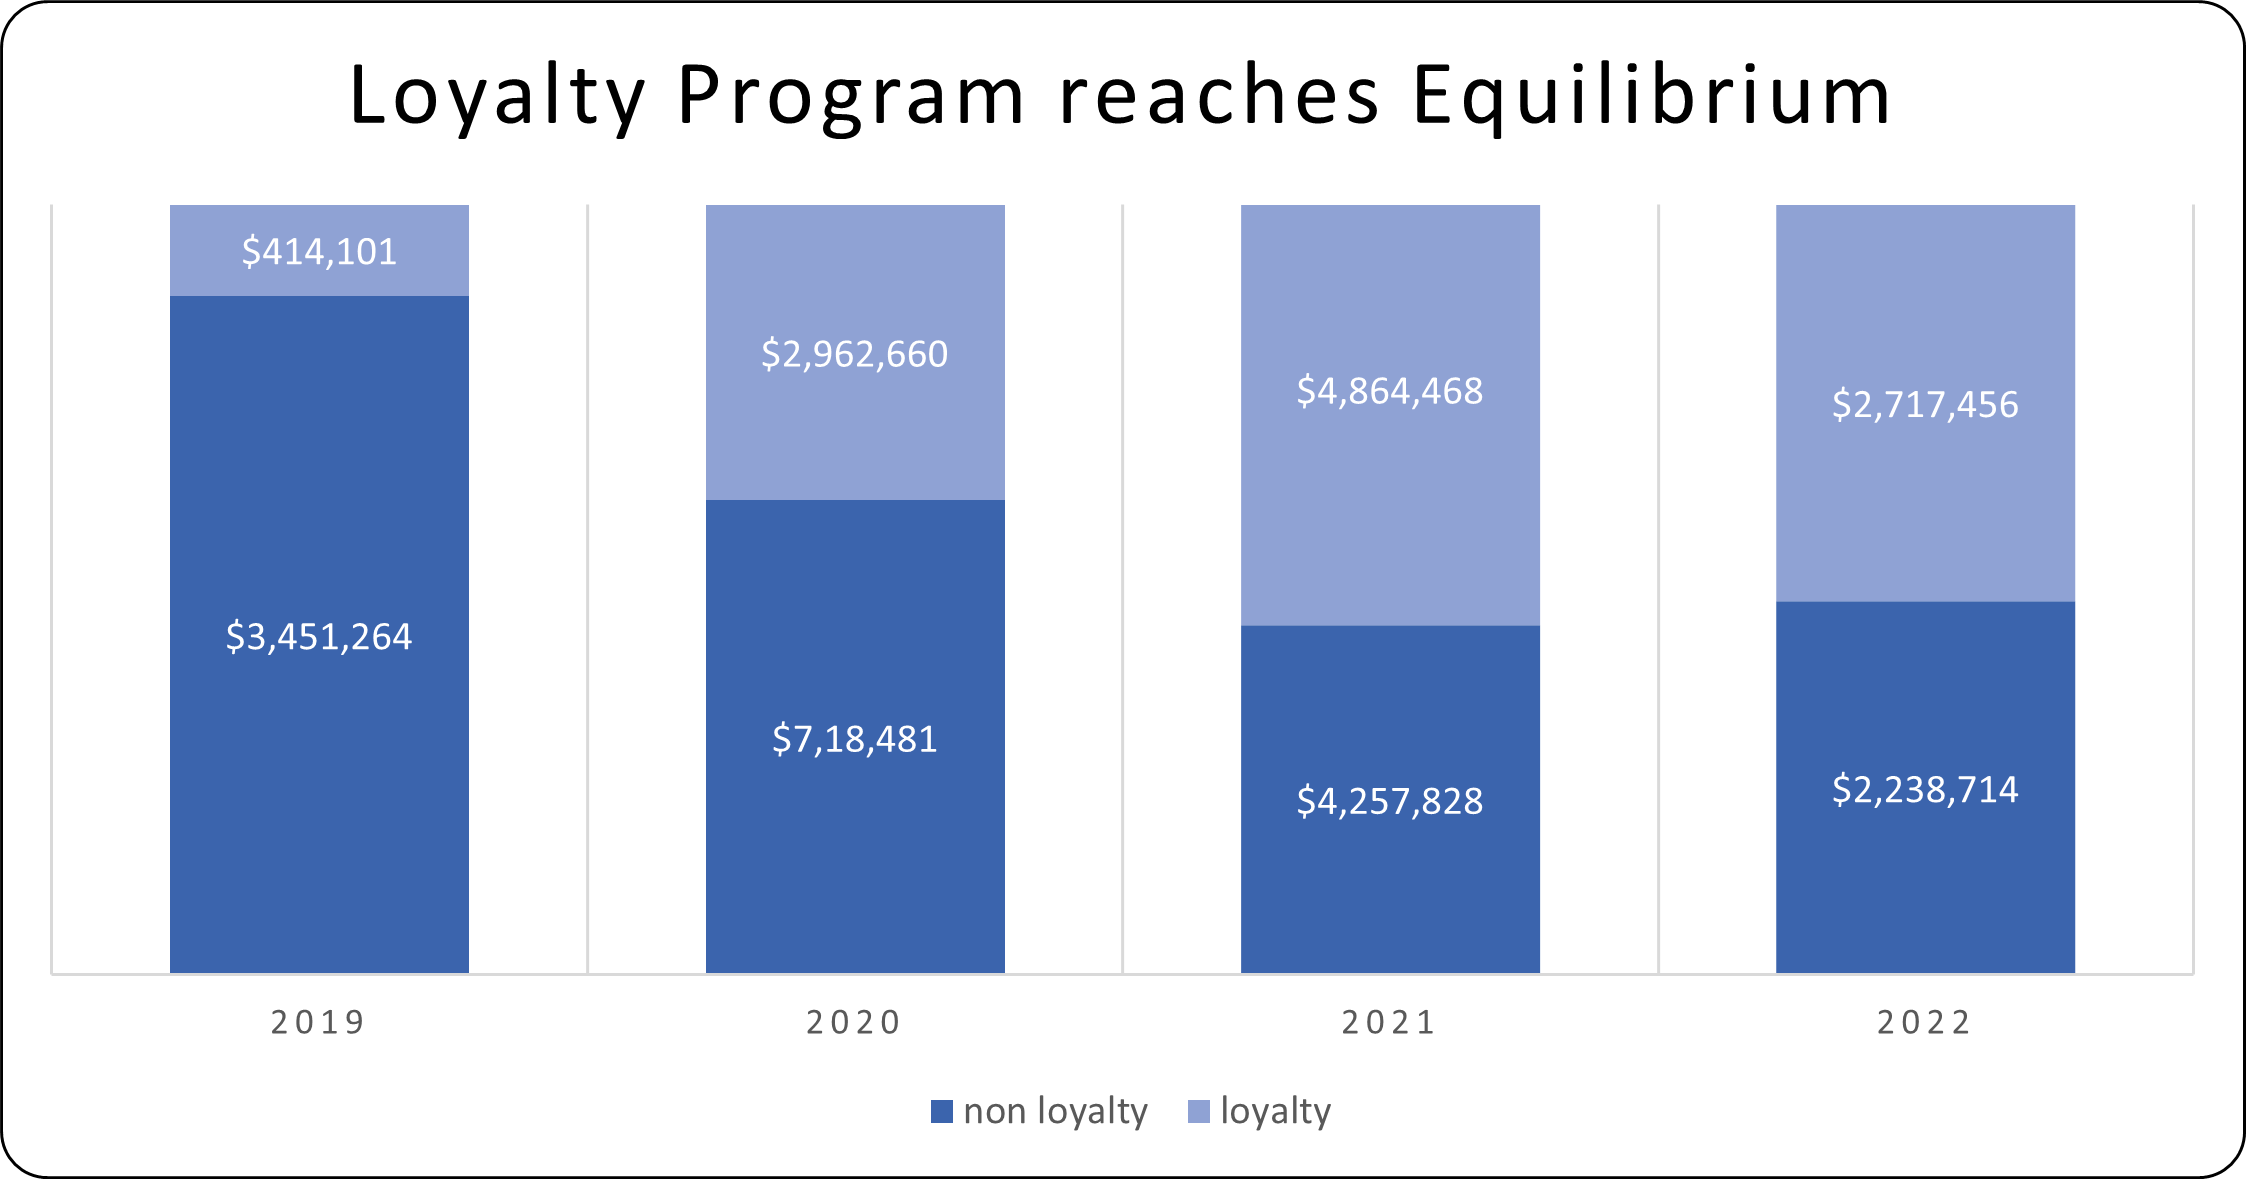
By 2022, spending by loyalty and non-loyalty members reached equilibrium, but non-loyalty members spending declined.
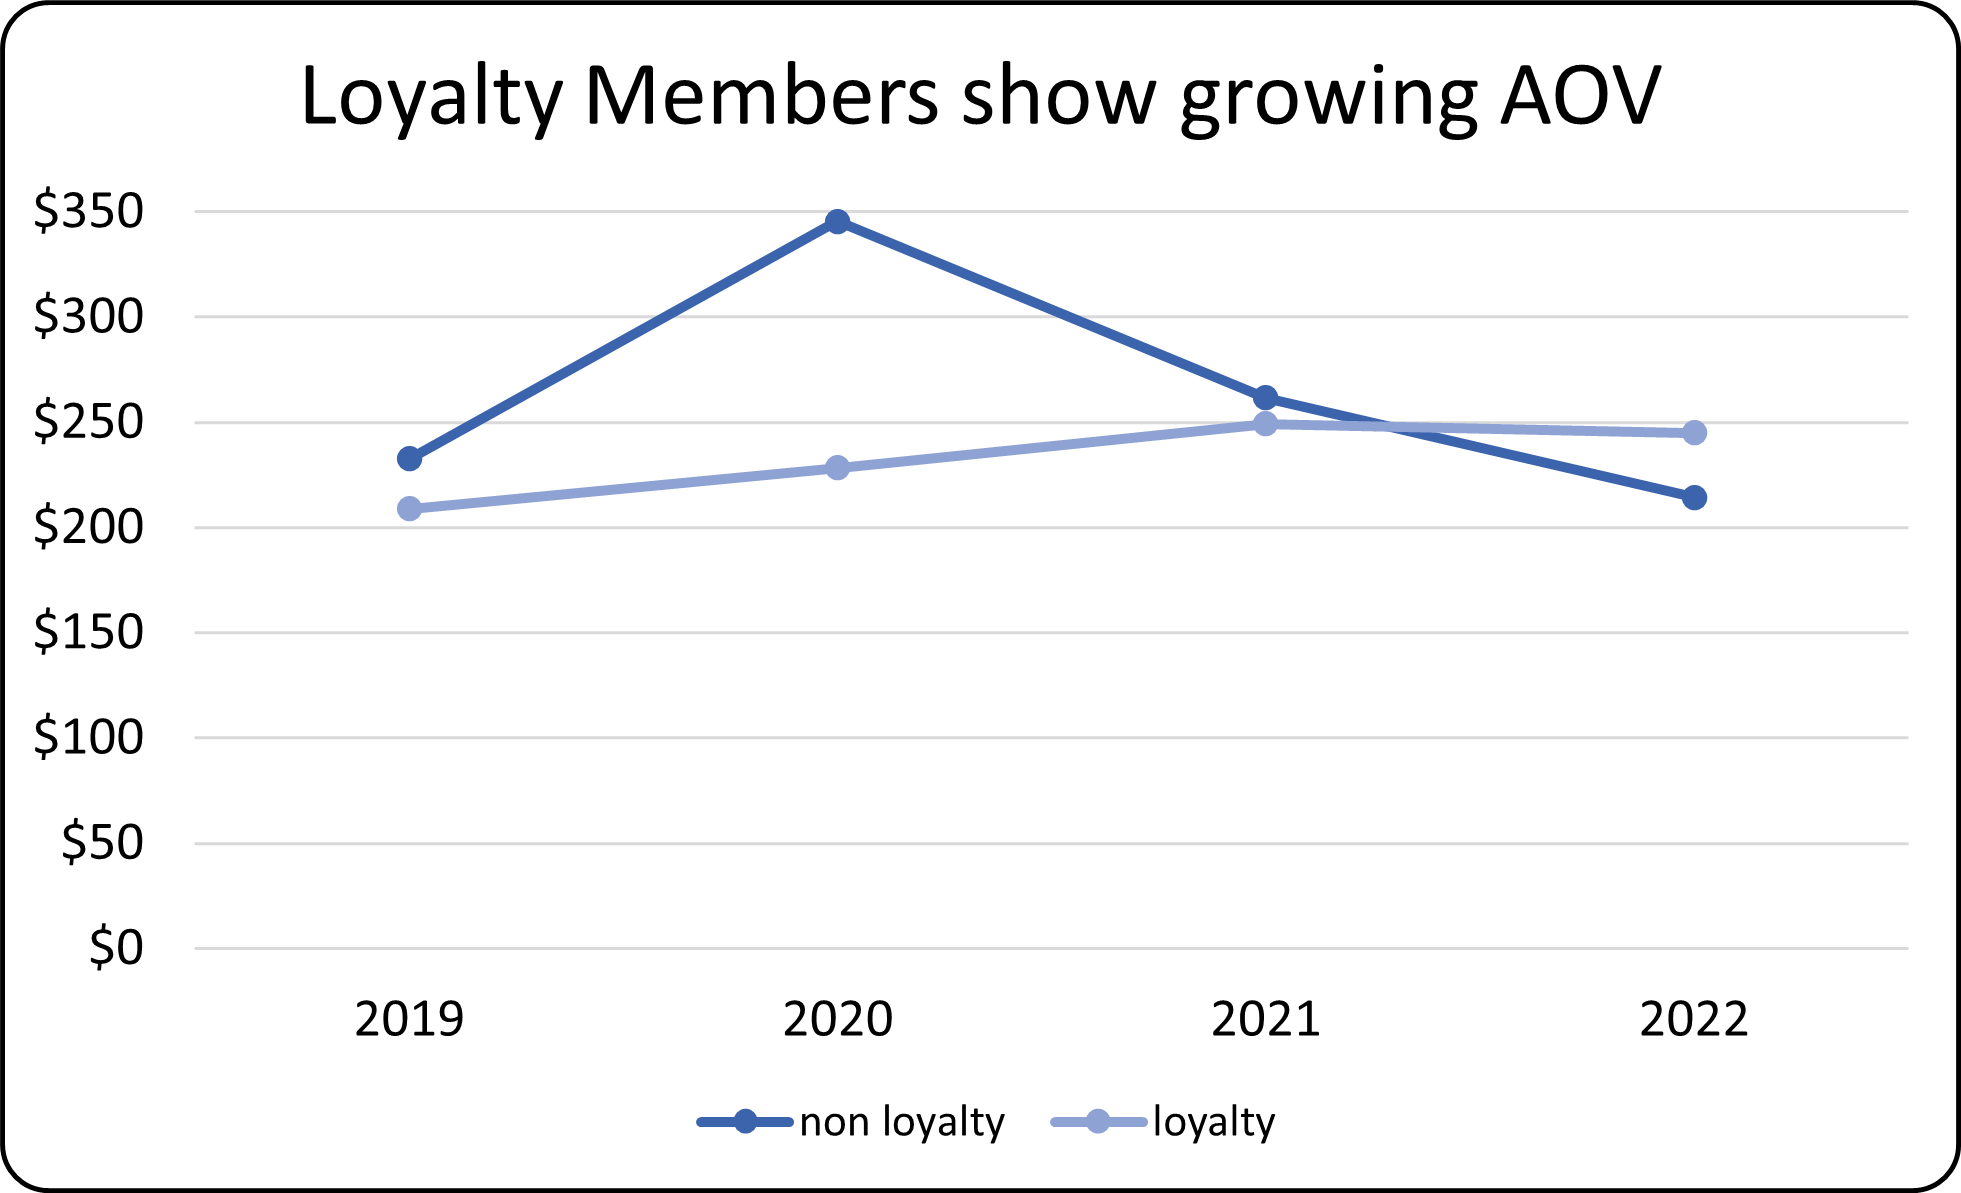
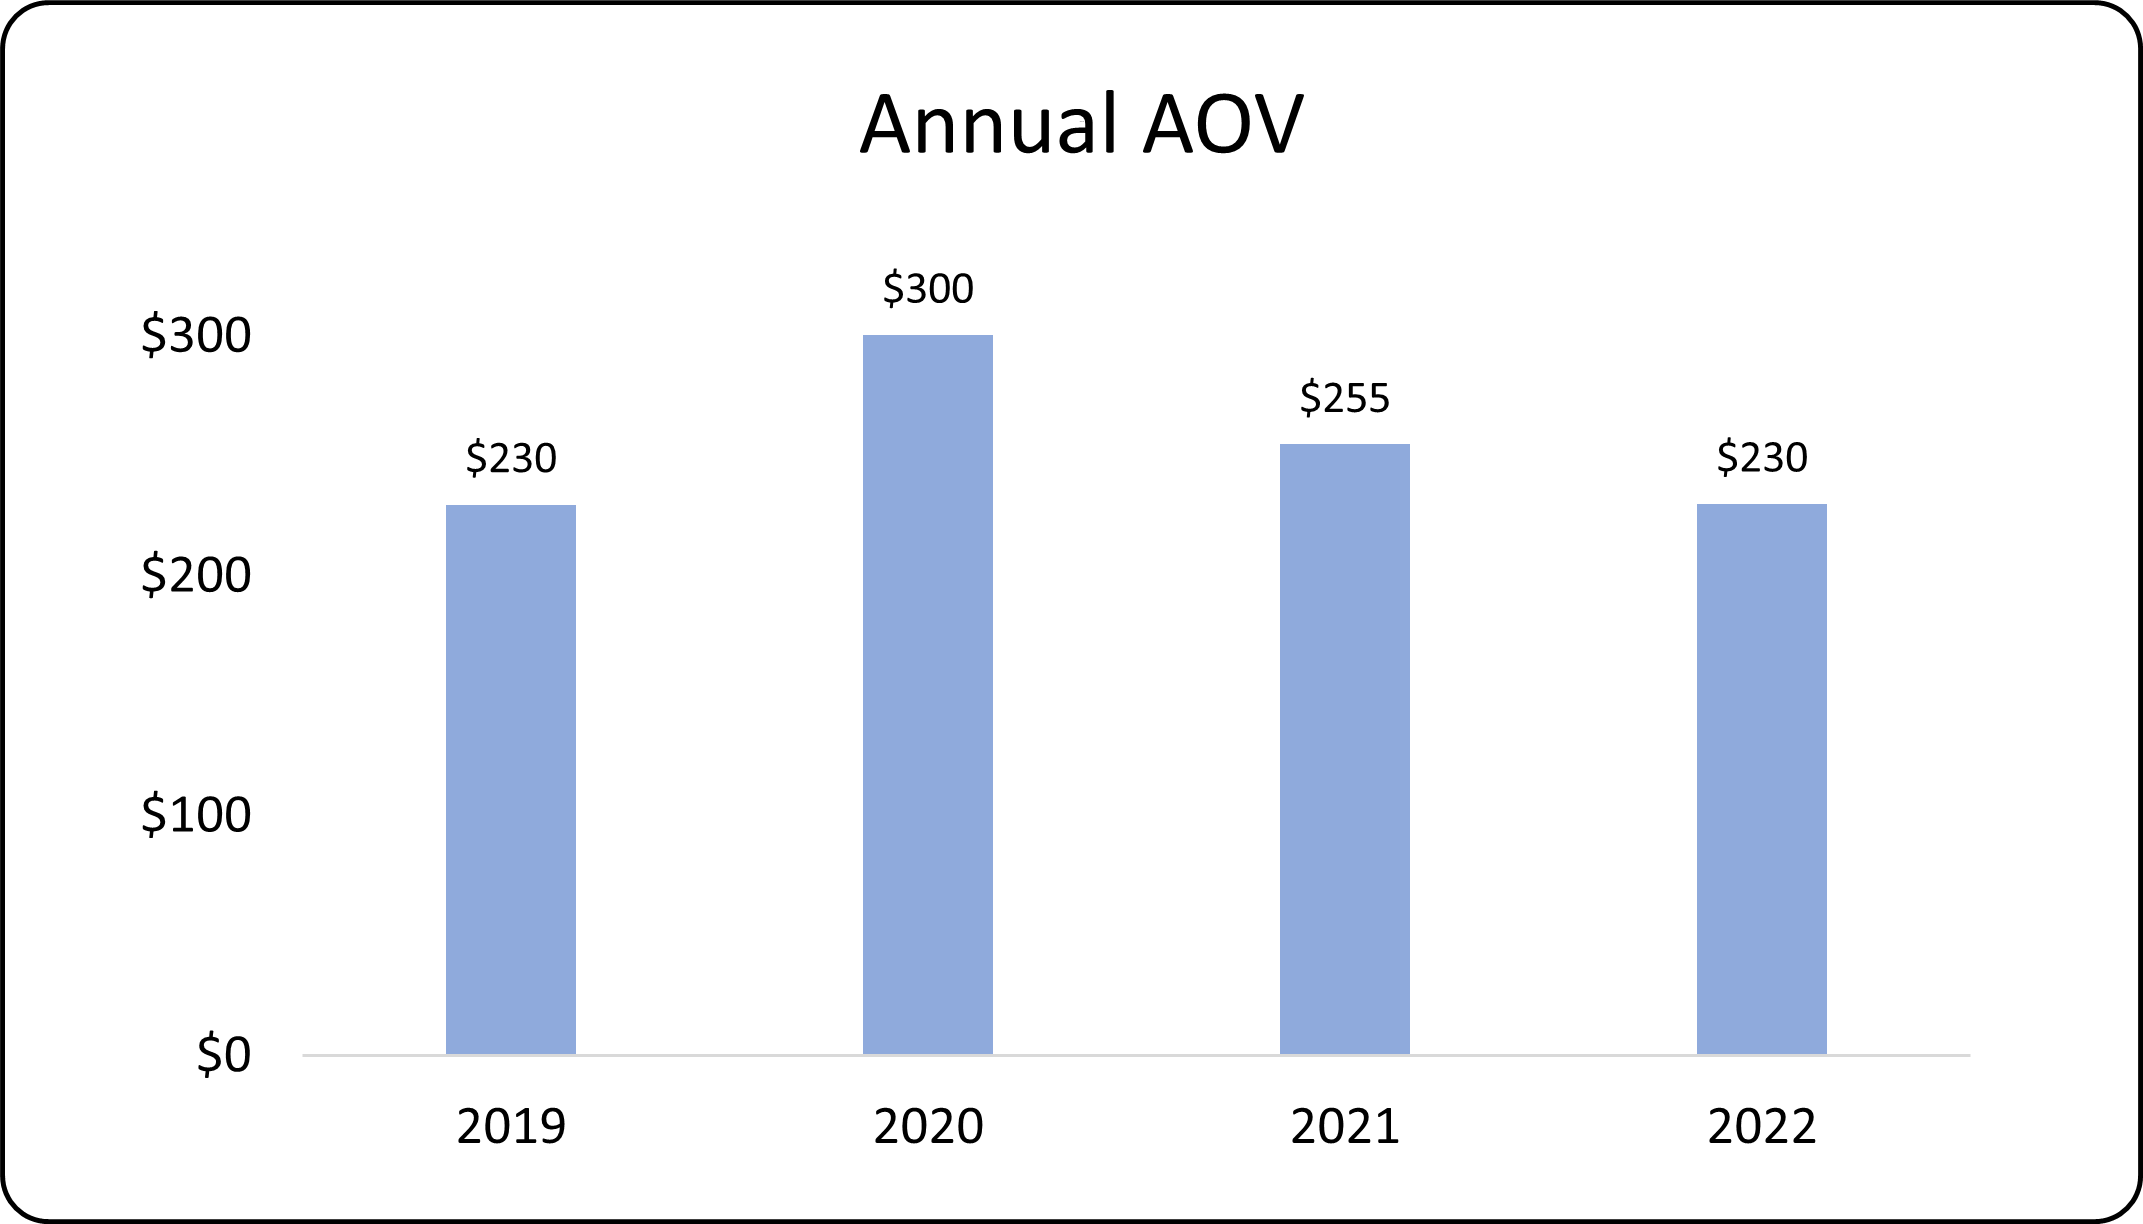
Loyalty members showed consistent growth in Average Order Value (AOV), surpassing non-loyalty members by 2021.
Refund Rates
The overall refund rate across all transactions is 6%.
The MacBook Air had the highest refund rate at 11%, followed by the Apple iPhone at 8%, and the Apple AirPods at 5%.

Deep Dive Insights
Sales Trends
Monthly Figures
September and December saw the highest number of sales ($2.7M and $2.8M) with February and October generating the lowest sales ($1.9M each).
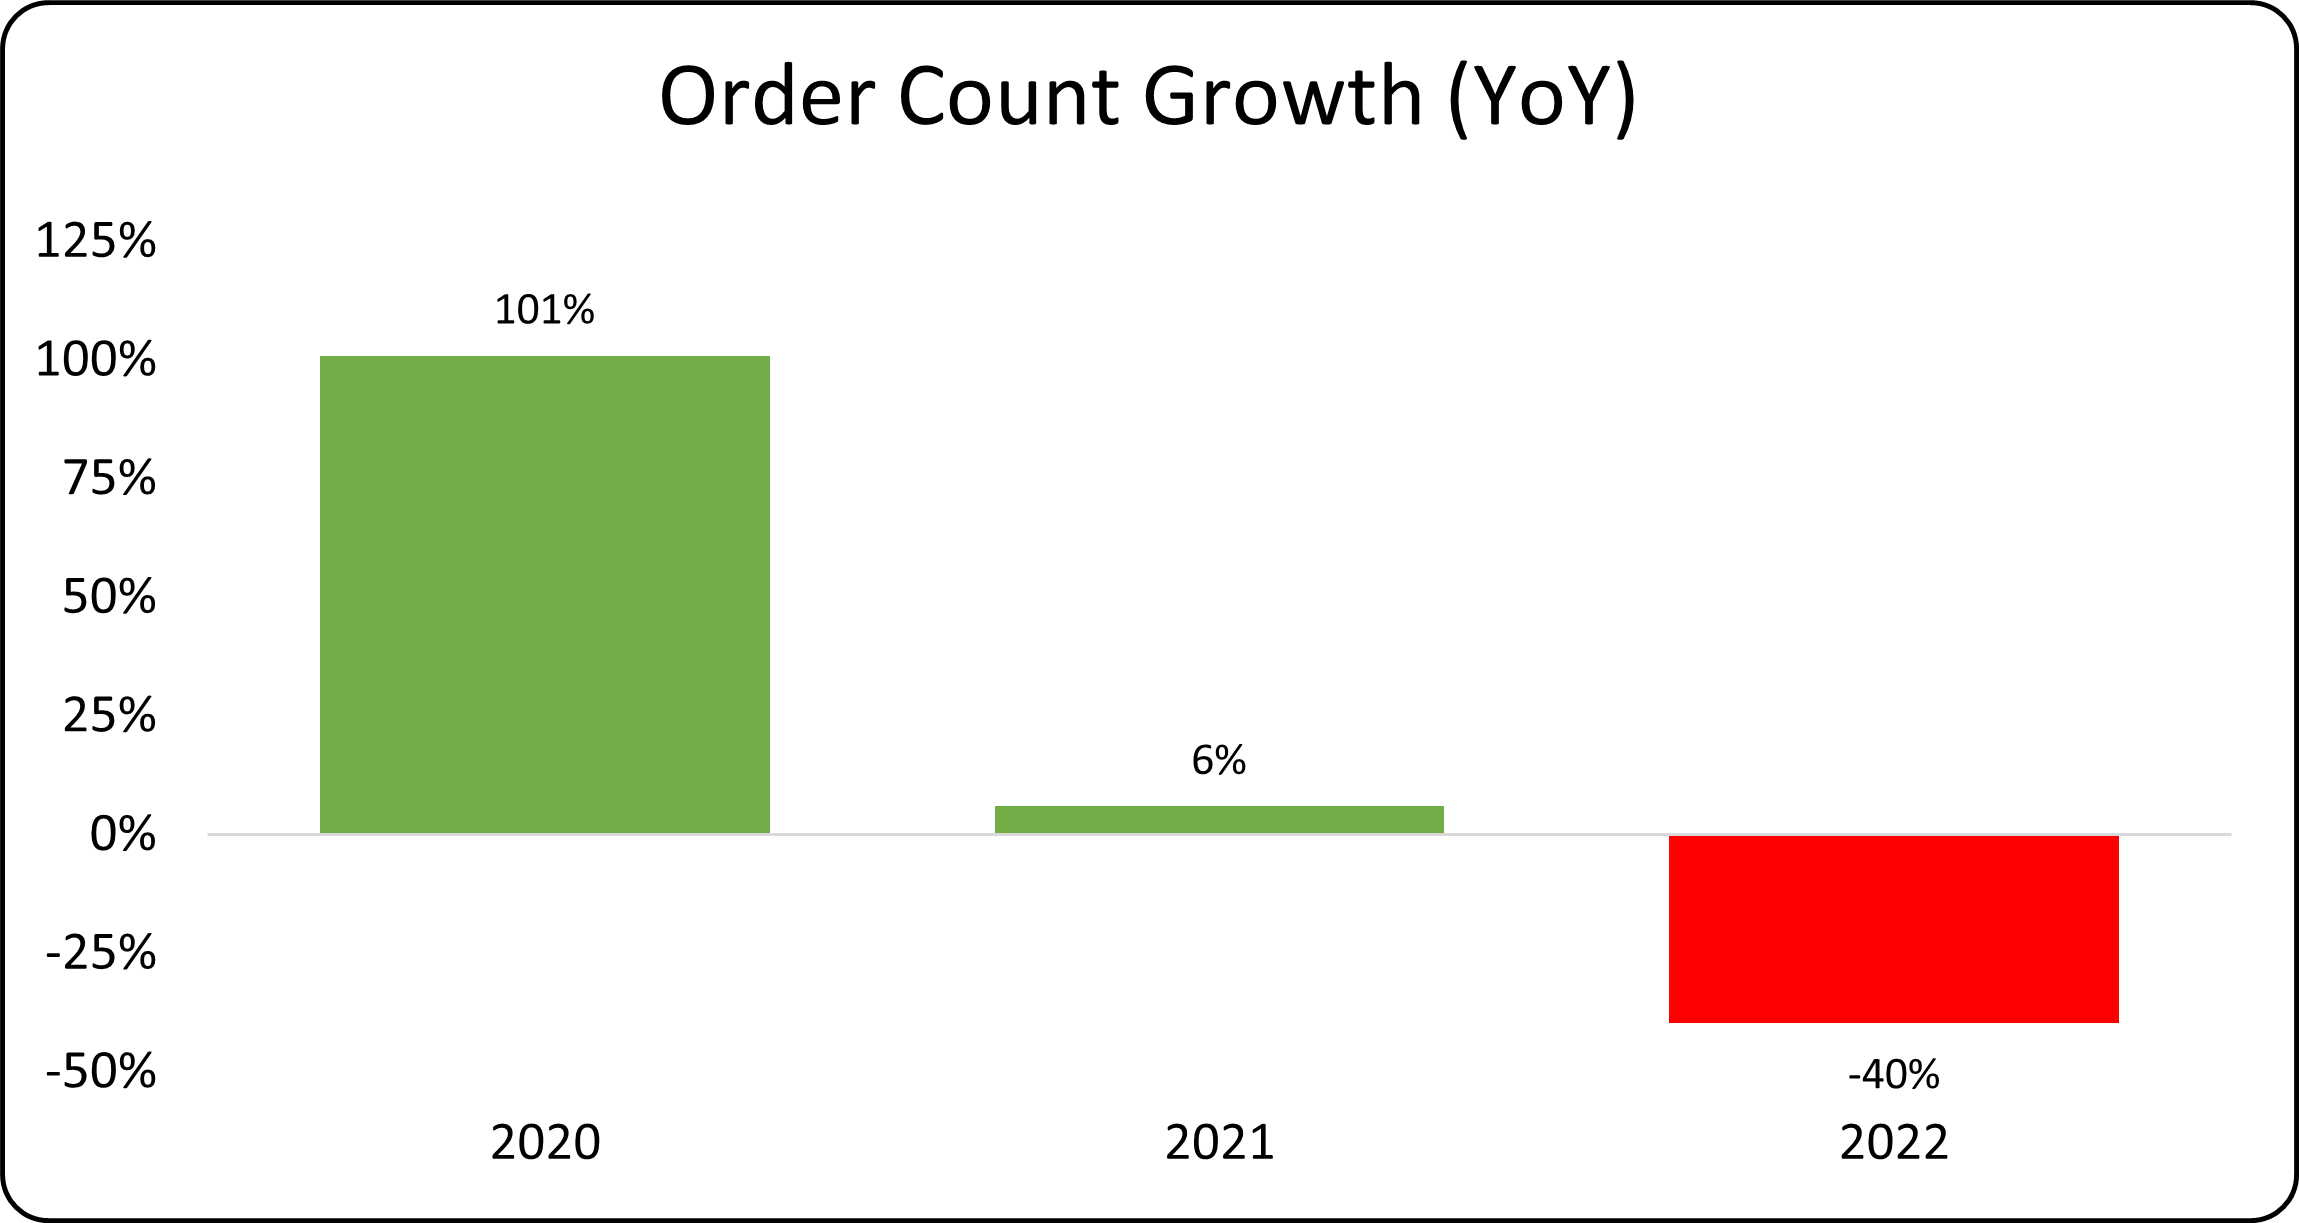
Sales and order count growth were aligned, with the highest month over month increase occurring in March 2020 at 50% and the steepest decline in October 2022 at -55%.
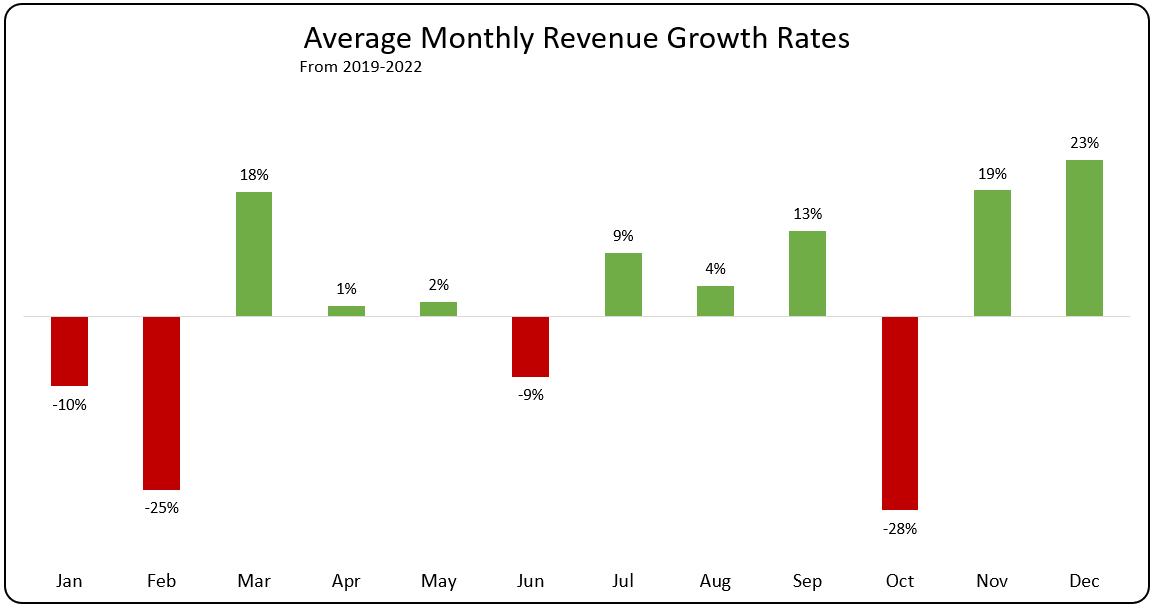
When looking in aggregate by month from 2019-2022, we saw that our highest sales occurred in January, September, and December at a peak of $1.2M sales in December of 2020.
The lowest sales occurring in February and October at a low of $178k in sales October of 2022.
A majority of sales are coming from North America accounting for $14M in total revenue, with Europe, Middle East, and Africa accounting for $8M, combined show for over 80% of the total revenue.
Product Trends
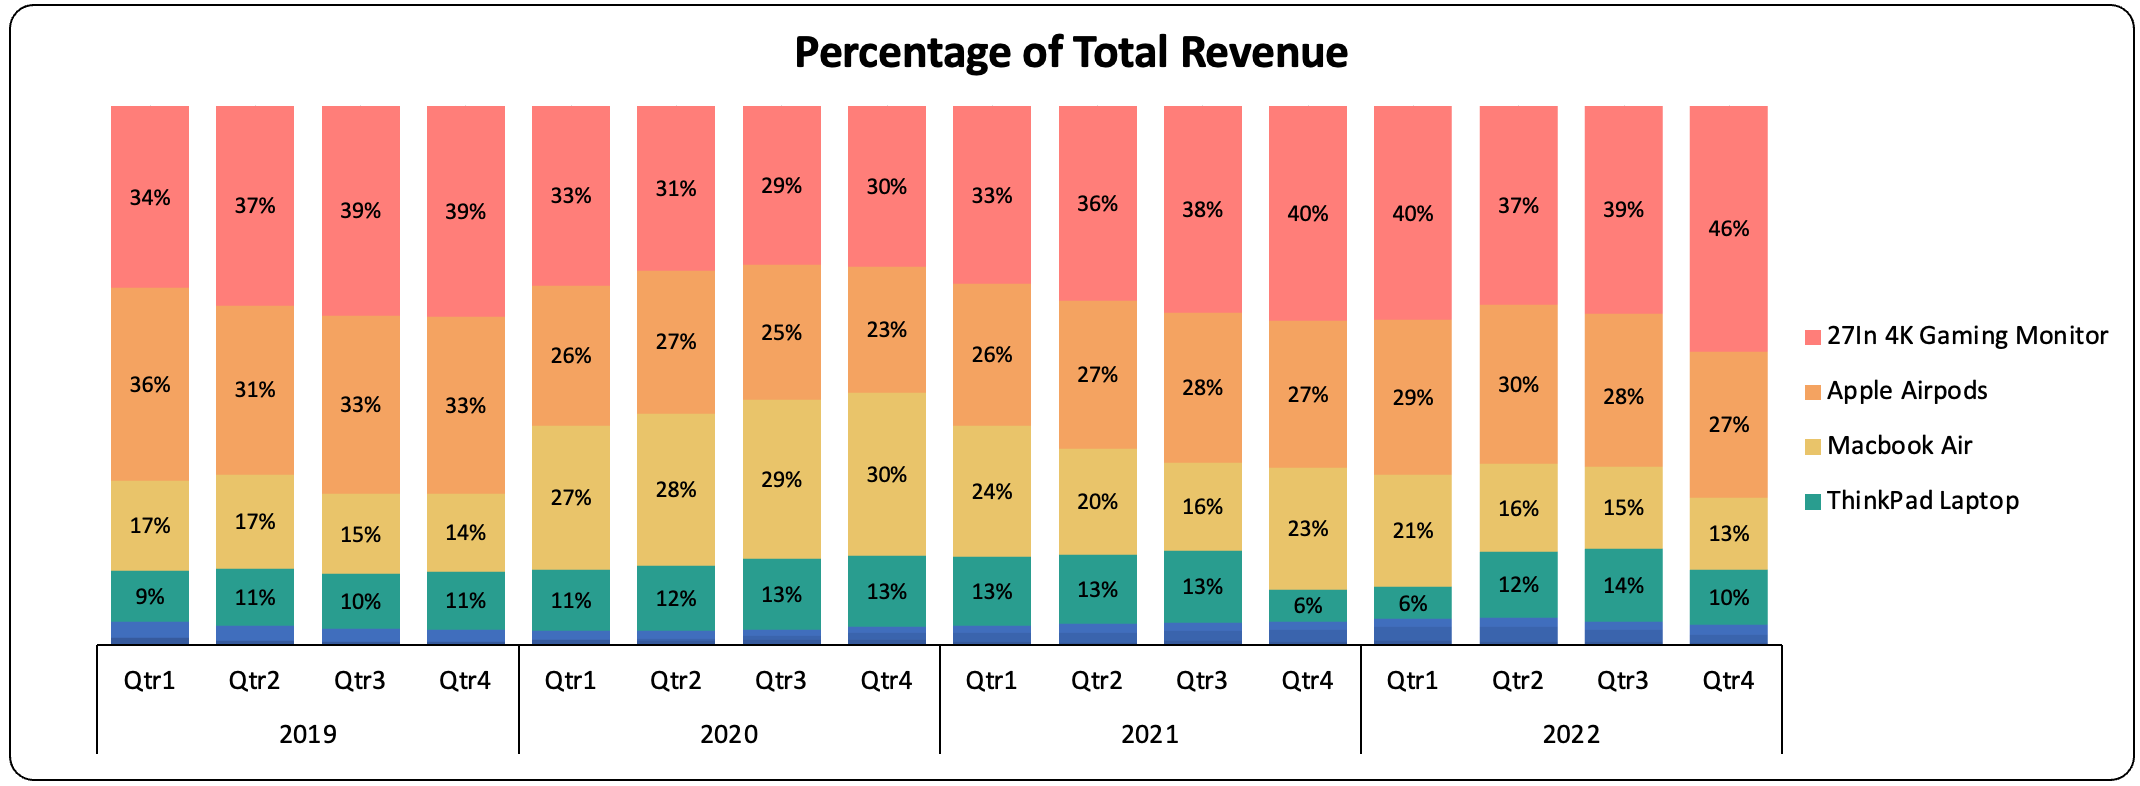
When looking into product sales, the best performing products are the 27In Gaming Monitor, Apple Airpods, Macbook Air, and ThinkPad Laptop accounting for 96% of all sales.
By brand, Apple is responsible for more than half of all sales, with Airpods generating $8M and the Macbook $6M.
In 2020, the Macbook Air drove a significant spike in revenue, with its share of revenue increasing by 84% from 2019, generating an additional $2.3 million in sales, including 255 orders in Q2 alone, totaling $392,260 with an average order value of $1,538.
While the top-performing 27in 4K Gaming Monitor experienced a 19% decrease in its percentage of total sales for that year.
From 2019-2022 the quarterly average of 98 Macbooks sold and generating an average quarterly sales of $155k. (Question 1)
Apple AirPods emerged as the most popular product across all regions, with the highest total orders in North America (18,574), EMEA (11,227), and Unknown (12,466). Notably, the LATAM and APAC (4,226) region recorded the lowest orders at 1,911, indicating variability in product popularity across different markets.
Loyalty Program
The loyalty program launched in 2019 with a slow rate of adoption where Non-Loyalty members outspent Loyalty Members during the first two years of the program. However in 2021, Loyalty Members began to outspend Non-Loyalty Members by over $500,000 as well as reaching a steady AOV of $245 versus $214 for Non-Loyalty Members.
Initially only 11% of all orders were made by Loyalty Members, however by 2021, over half of all orders were placed by members of the loyalty program.
Loyalty members on average took 49 days to purchase an item after creating their account, 30% quicker than Non-loyalty members that took 70 days to purchase.